SO WHAT?
Making Sense of the Numbers
RII includes data from cities representing nearly half of Minnesota’s population. It includes municipalities of varying sizes and types — from the state’s largest urban cores to mid-sized suburbs to rural centers as small as 500 people. Through the process of compiling over ten years of data for these cities, certain trends have emerged. Key findings are visualized and explained below.
ENERGY
|
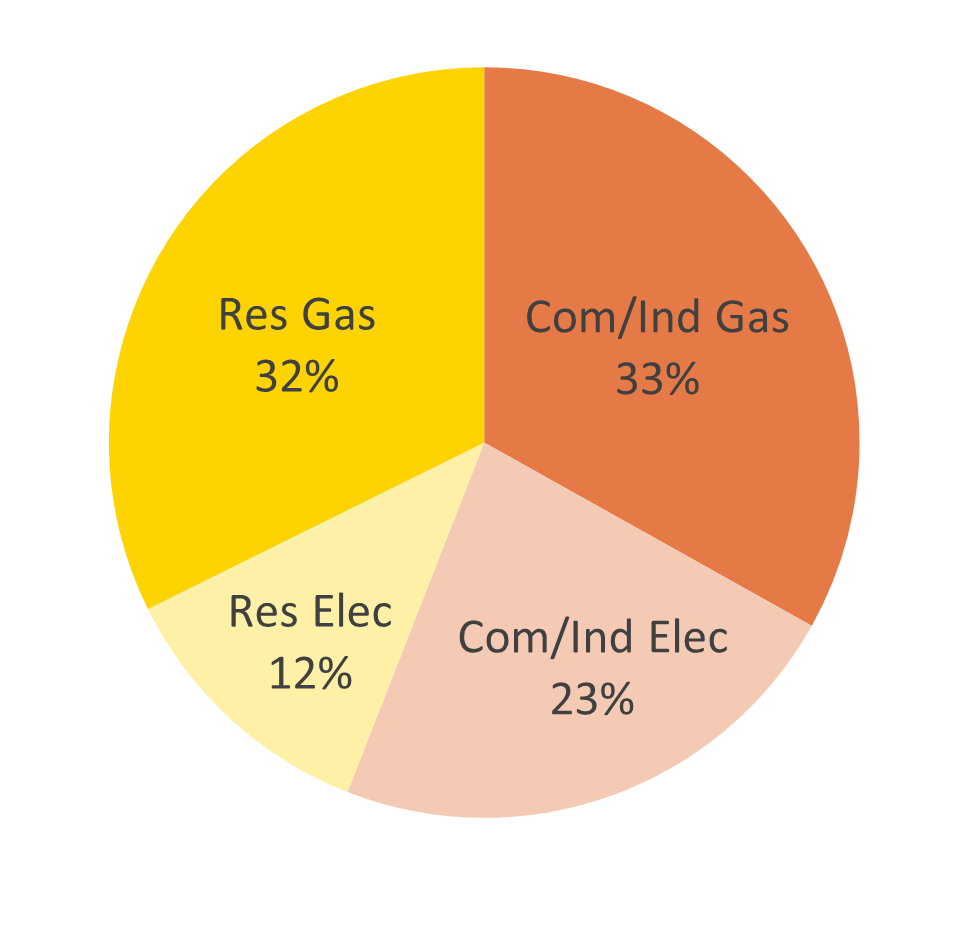
We use more gas than electricity. In 2020, two-thirds of the energy used within RII cities was gas, which is commonly used for space and water heating, cooking, and many industrial processes. We use more energy in non-residential buildings than we do in homes. While the commercial/industrial sector uses about the same amount of gas as the residential sector, it uses nearly twice as much electricity. This breakdown by sector and energy type varies quite a bit between communities; city-specific breakdowns can be found on the City Summaries page. |
ENERGY USE BREAKDOWN
|
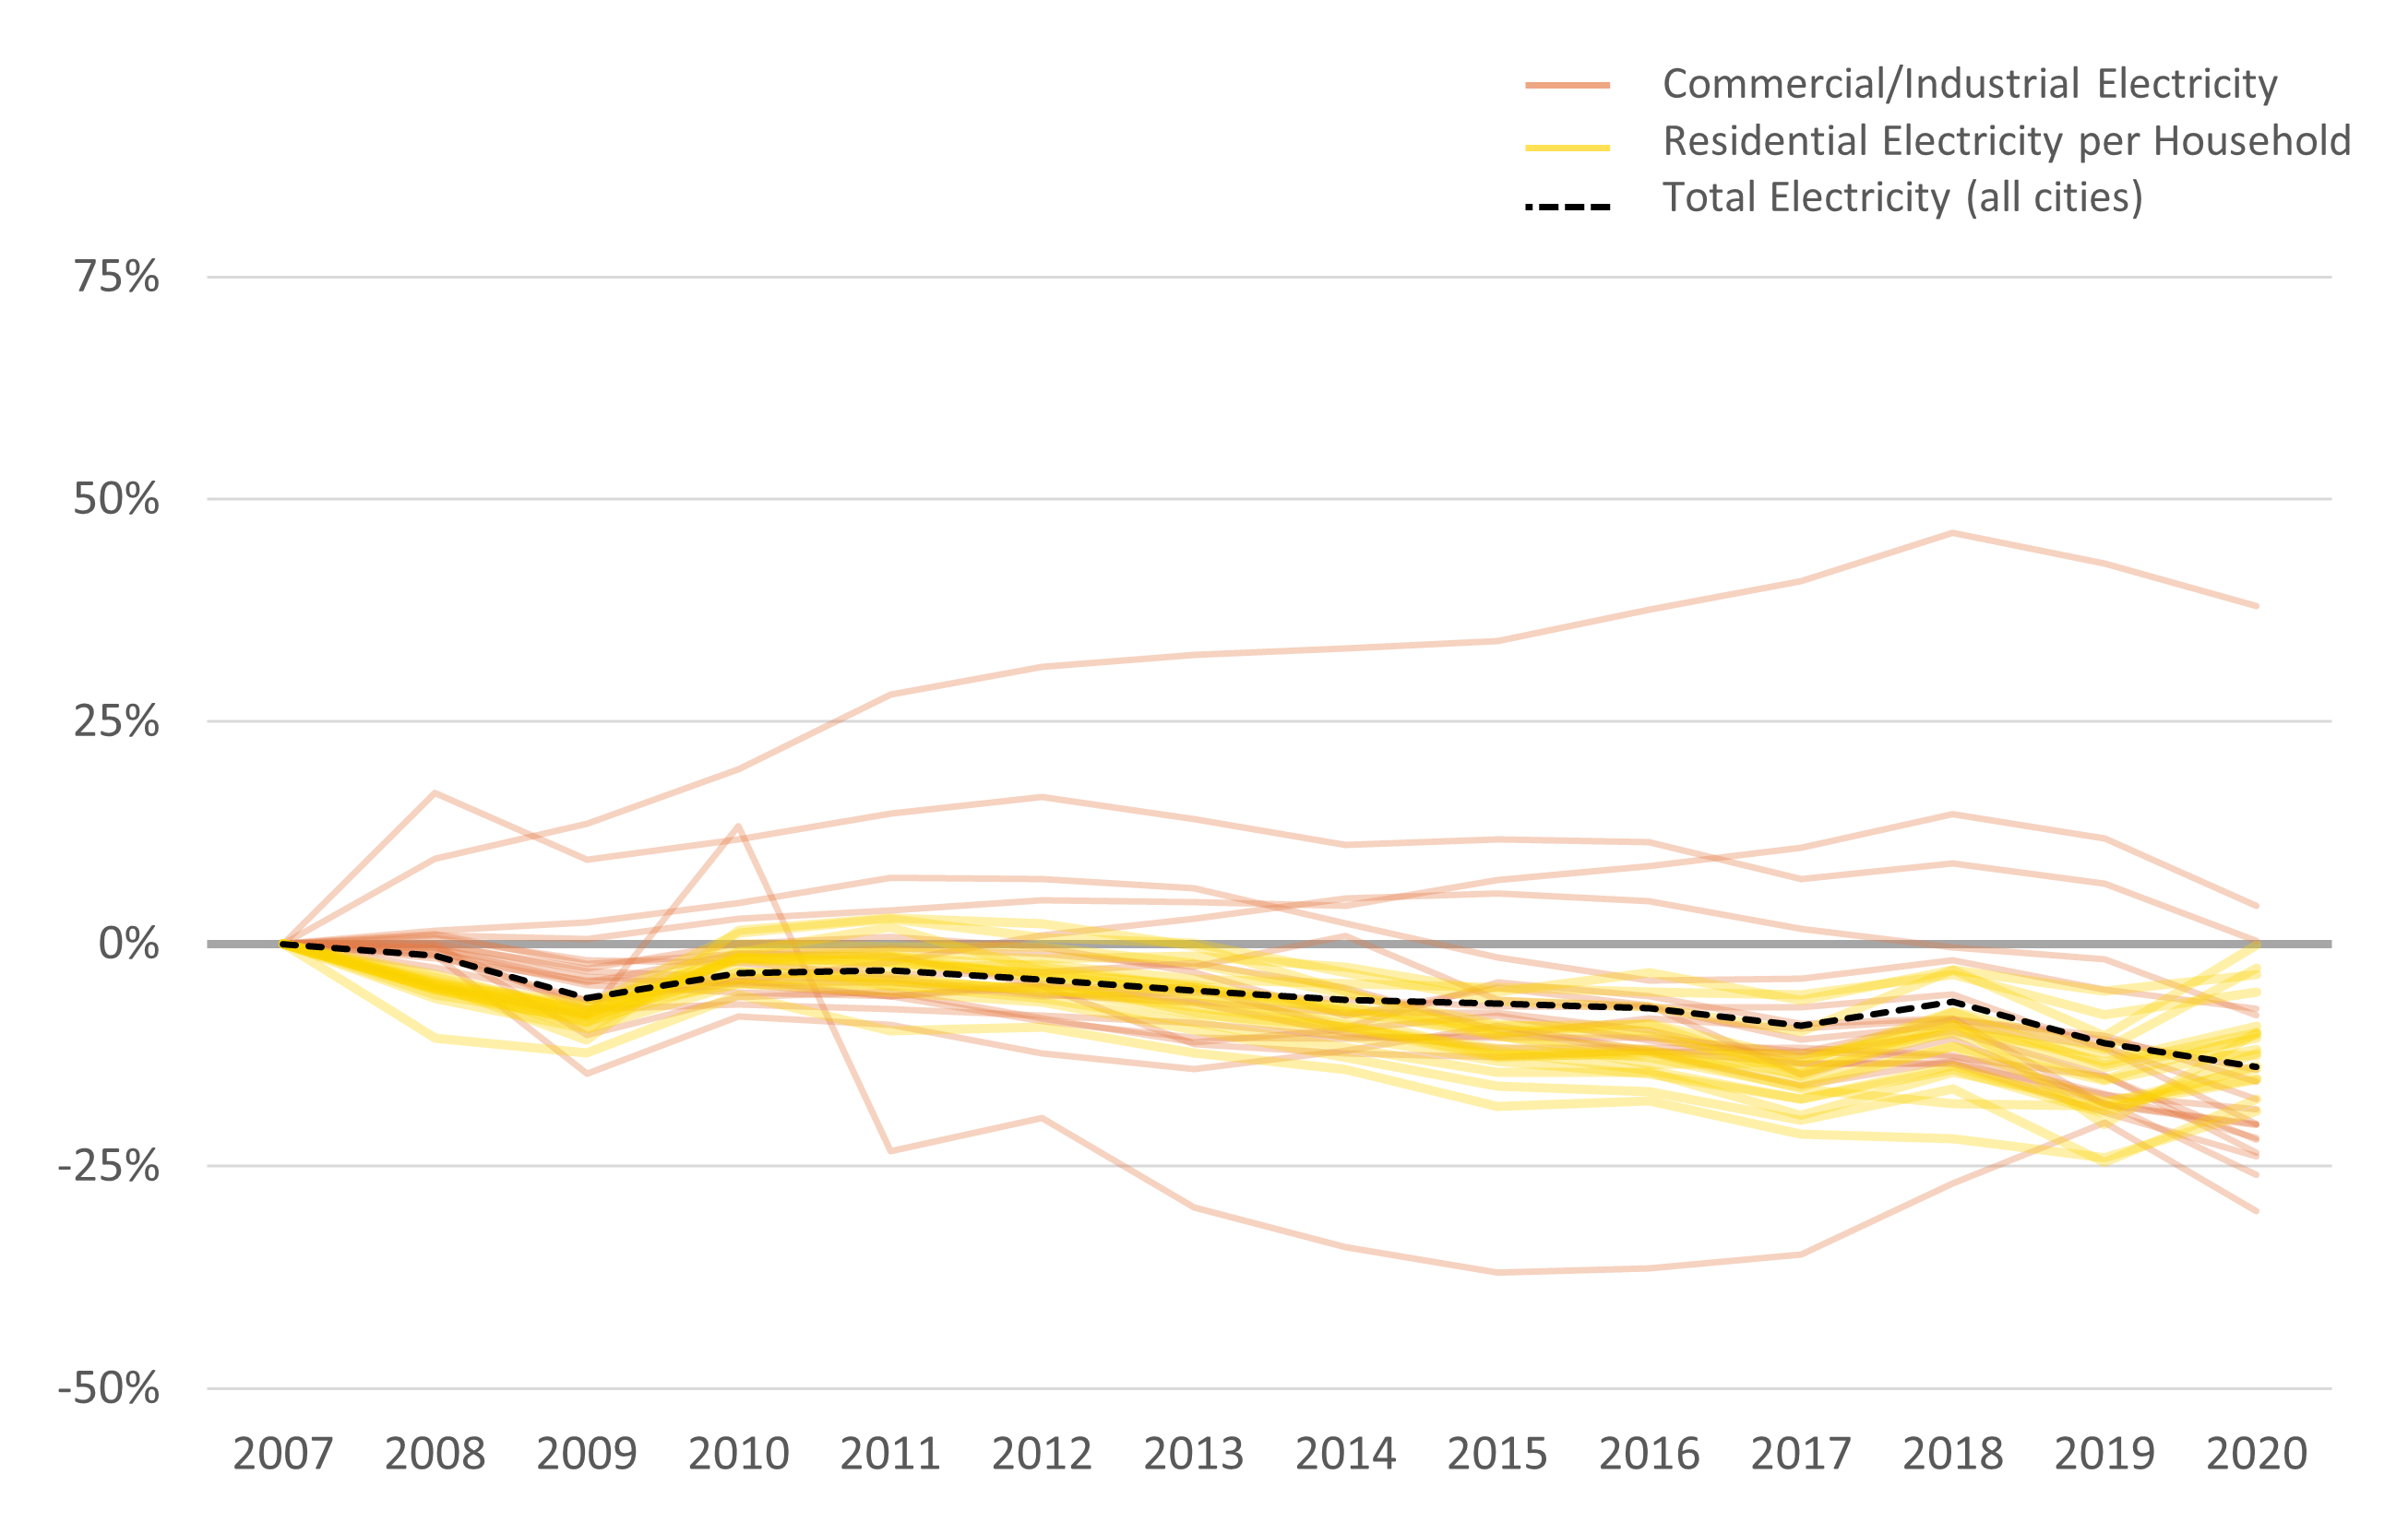
Electricity use is decreasing. Gas use is not.
Electricity use has decreased in most cities — both in homes and businesses — likely due to actions like replacing lighting with LEDs. The average city saw a 14% drop in electricity use from 2007 to 2020. Since gas is used primarily for heating, it varies significantly from year to year due to changes in the weather. However, even accounting for weather, the gas use in most cities has increased since 2007, with an average increase of 3%.
This dependency on the weather makes us vulnerable — threatening both our ability to pay for the energy we need and our ability to shelter in place if our energy supply is disrupted. The data points to the need to weatherize our buildings while also making efficiency gains by switching to electricity; an electric heat pump can be three times as efficient as a gas furnace since it moves heat rather than creating it.
WATER
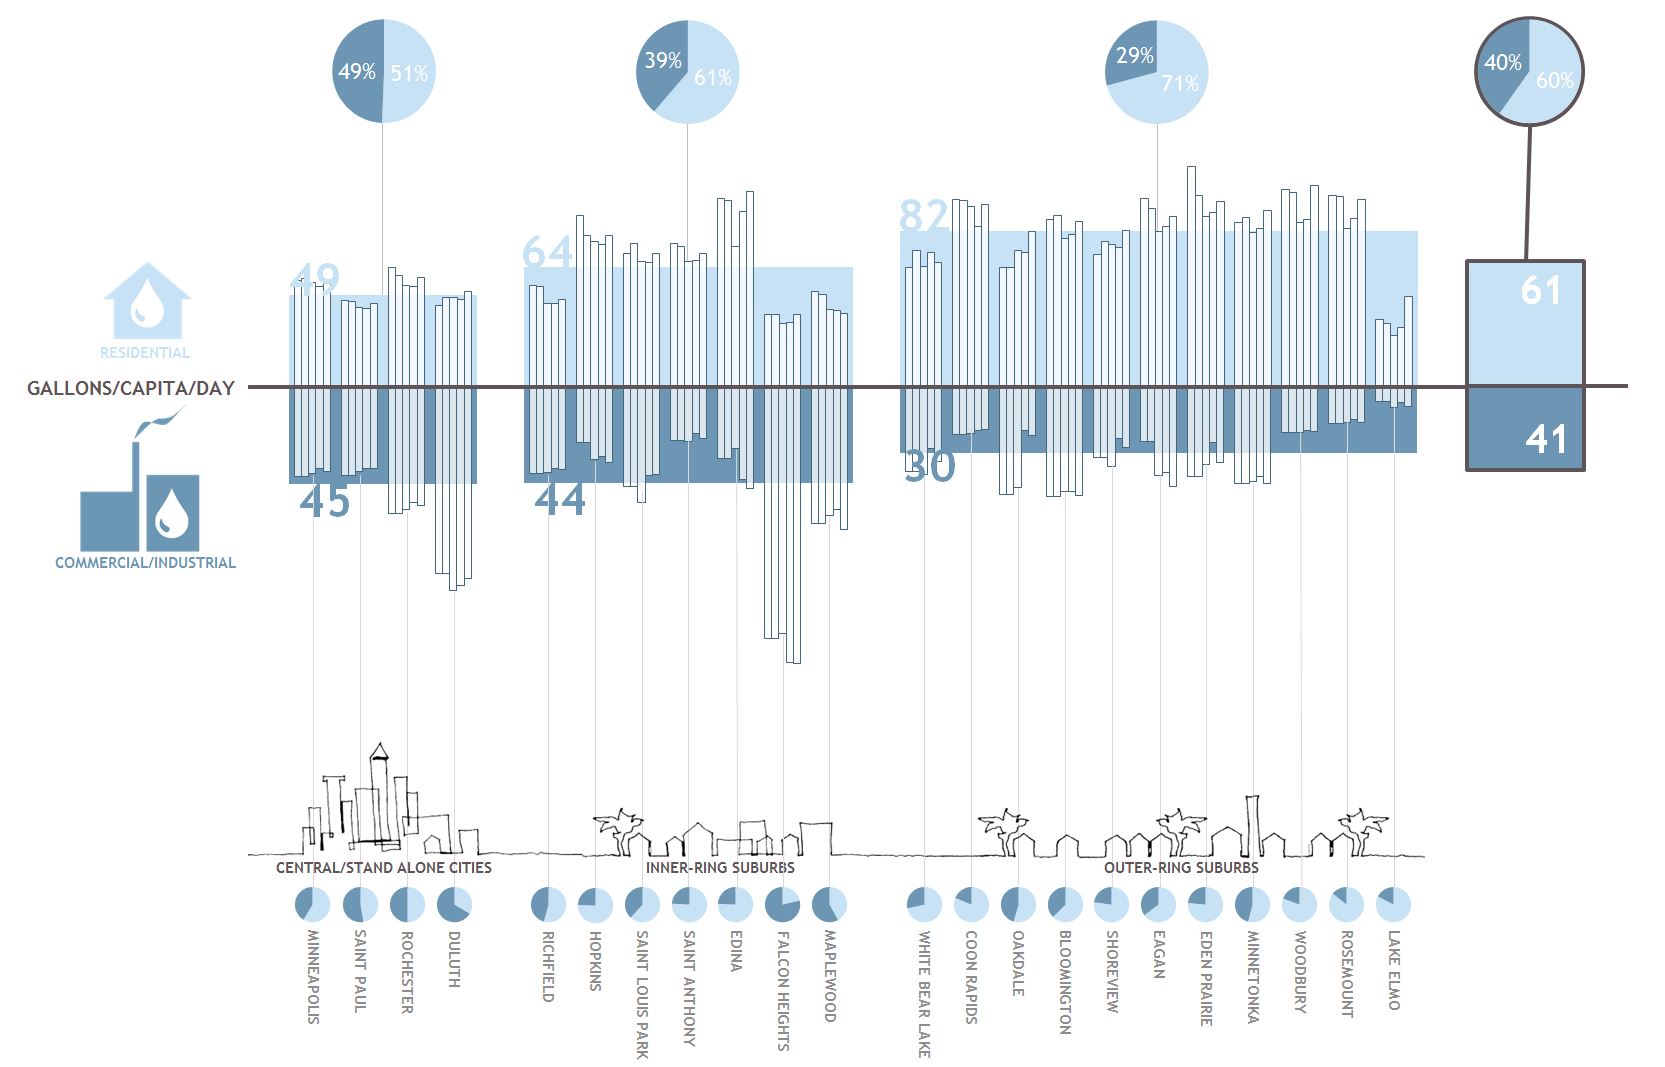
Though water data has not been recently updated for most cities, results from 2007-2013 show that homes are using more of the municipal water supply than businesses. This is especially true in suburban cities, which are using more water per household than urban cities — likely due to the irrigation of larger lots.
WATER USE BY SECTOR
22 CITIES | 2008-2012 TRENDS WITH 2011 SECTOR BREAKDOWN
TRAVEL
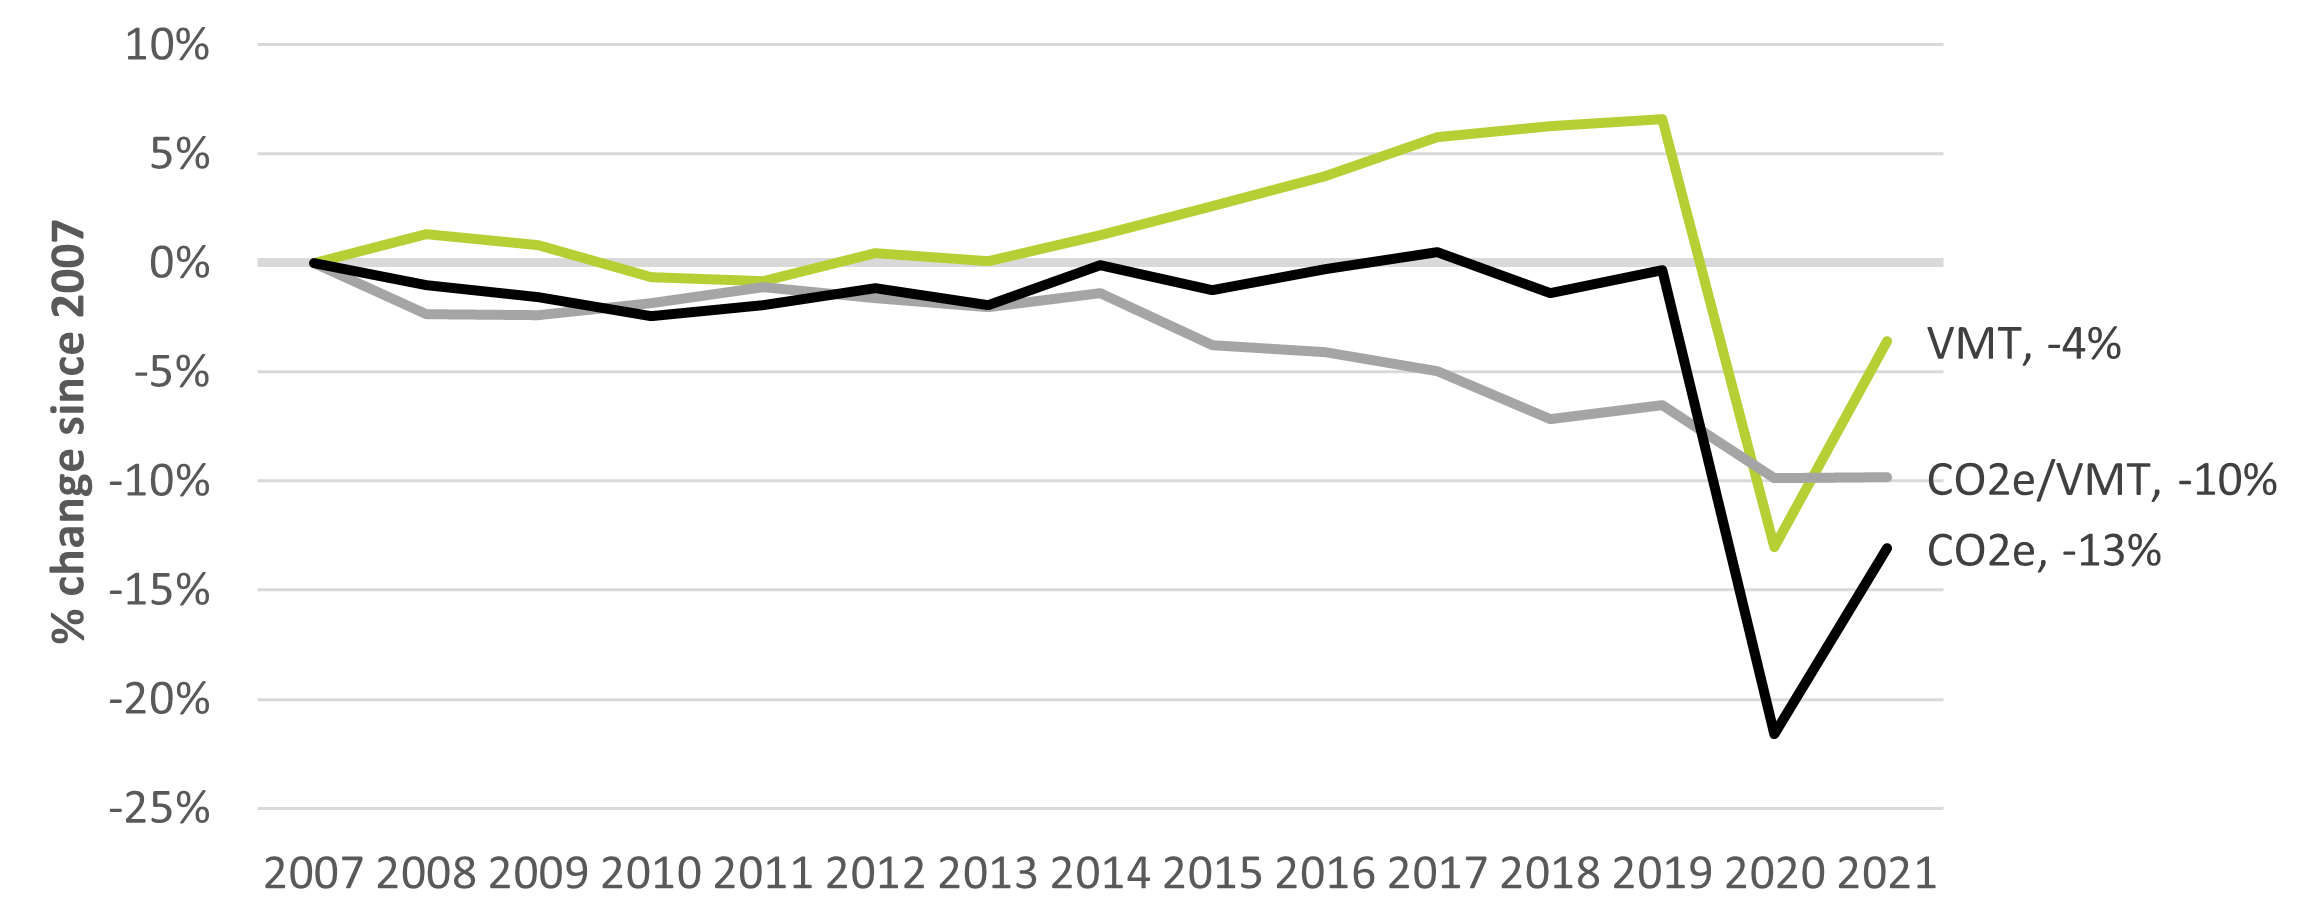
Local action, regional efforts, and market-scale transformation are all needed to make a lasting impact.
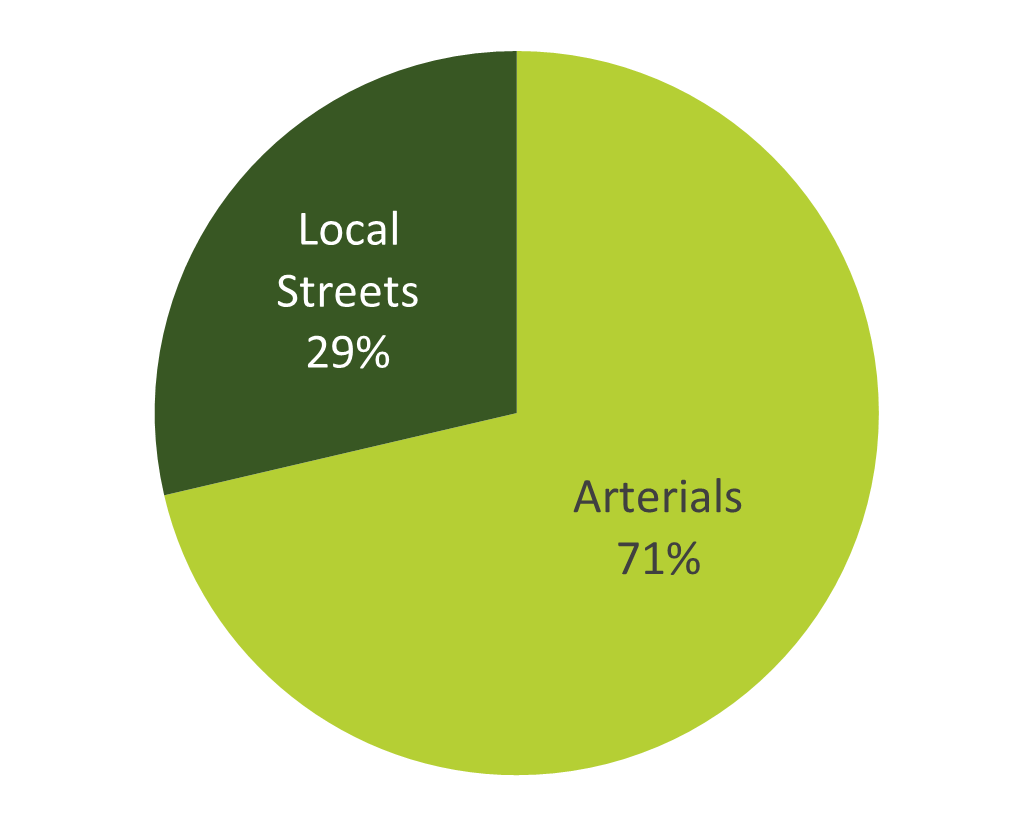
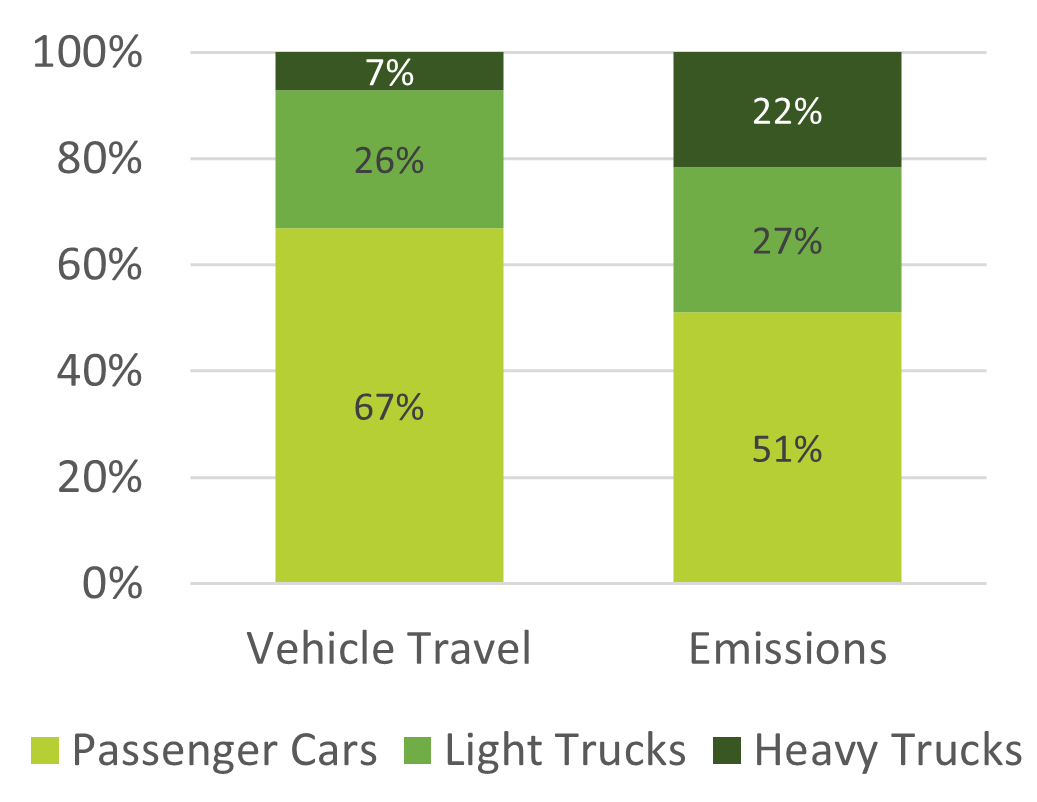
With nearly 30% of vehicle travel occurring on local roads, cities can directly impact VMT through their land use decisions and pedestrian and bike infrastructure. However, we also need to work to improve mobility options and shipping efficiency at a regional scale since most VMT is occurring on interstates and other arterials.
While the majority of VMT and emissions are from passenger cars and trucks, heavy trucks emit more per mile traveled. This suggests that small-scale strategies like switching to electric garbage trucks can have a large impact, but that reaching our GHG reduction goals will also require implementing long-term VMT reduction strategies and supporting the rapid electrification of passenger vehicles. The gradual improvements in fuel economy we have seen over the past decade are not getting us there fast enough.
WASTE
|
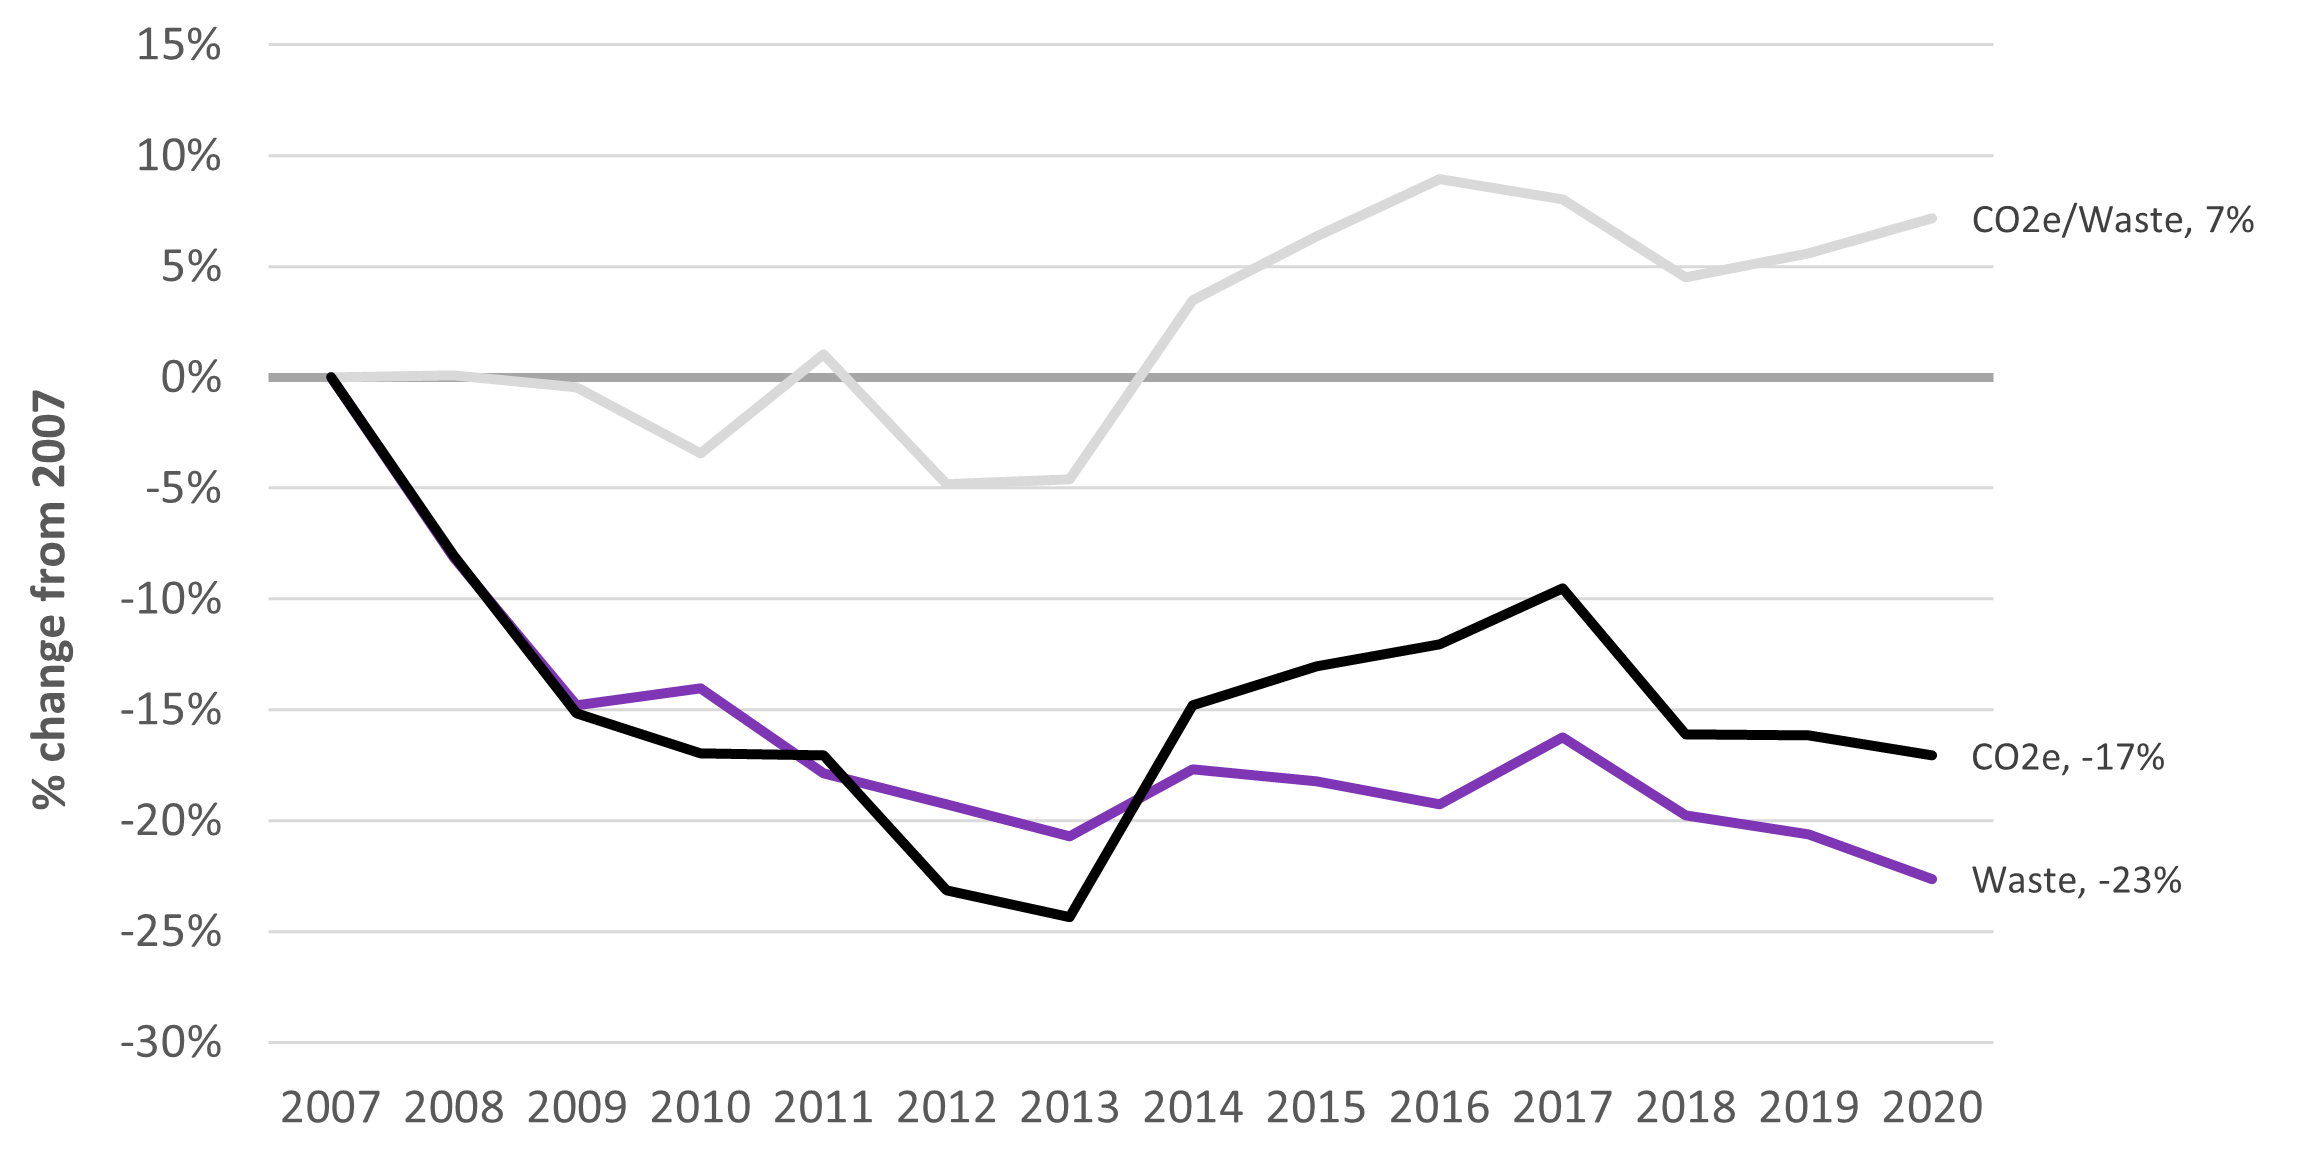
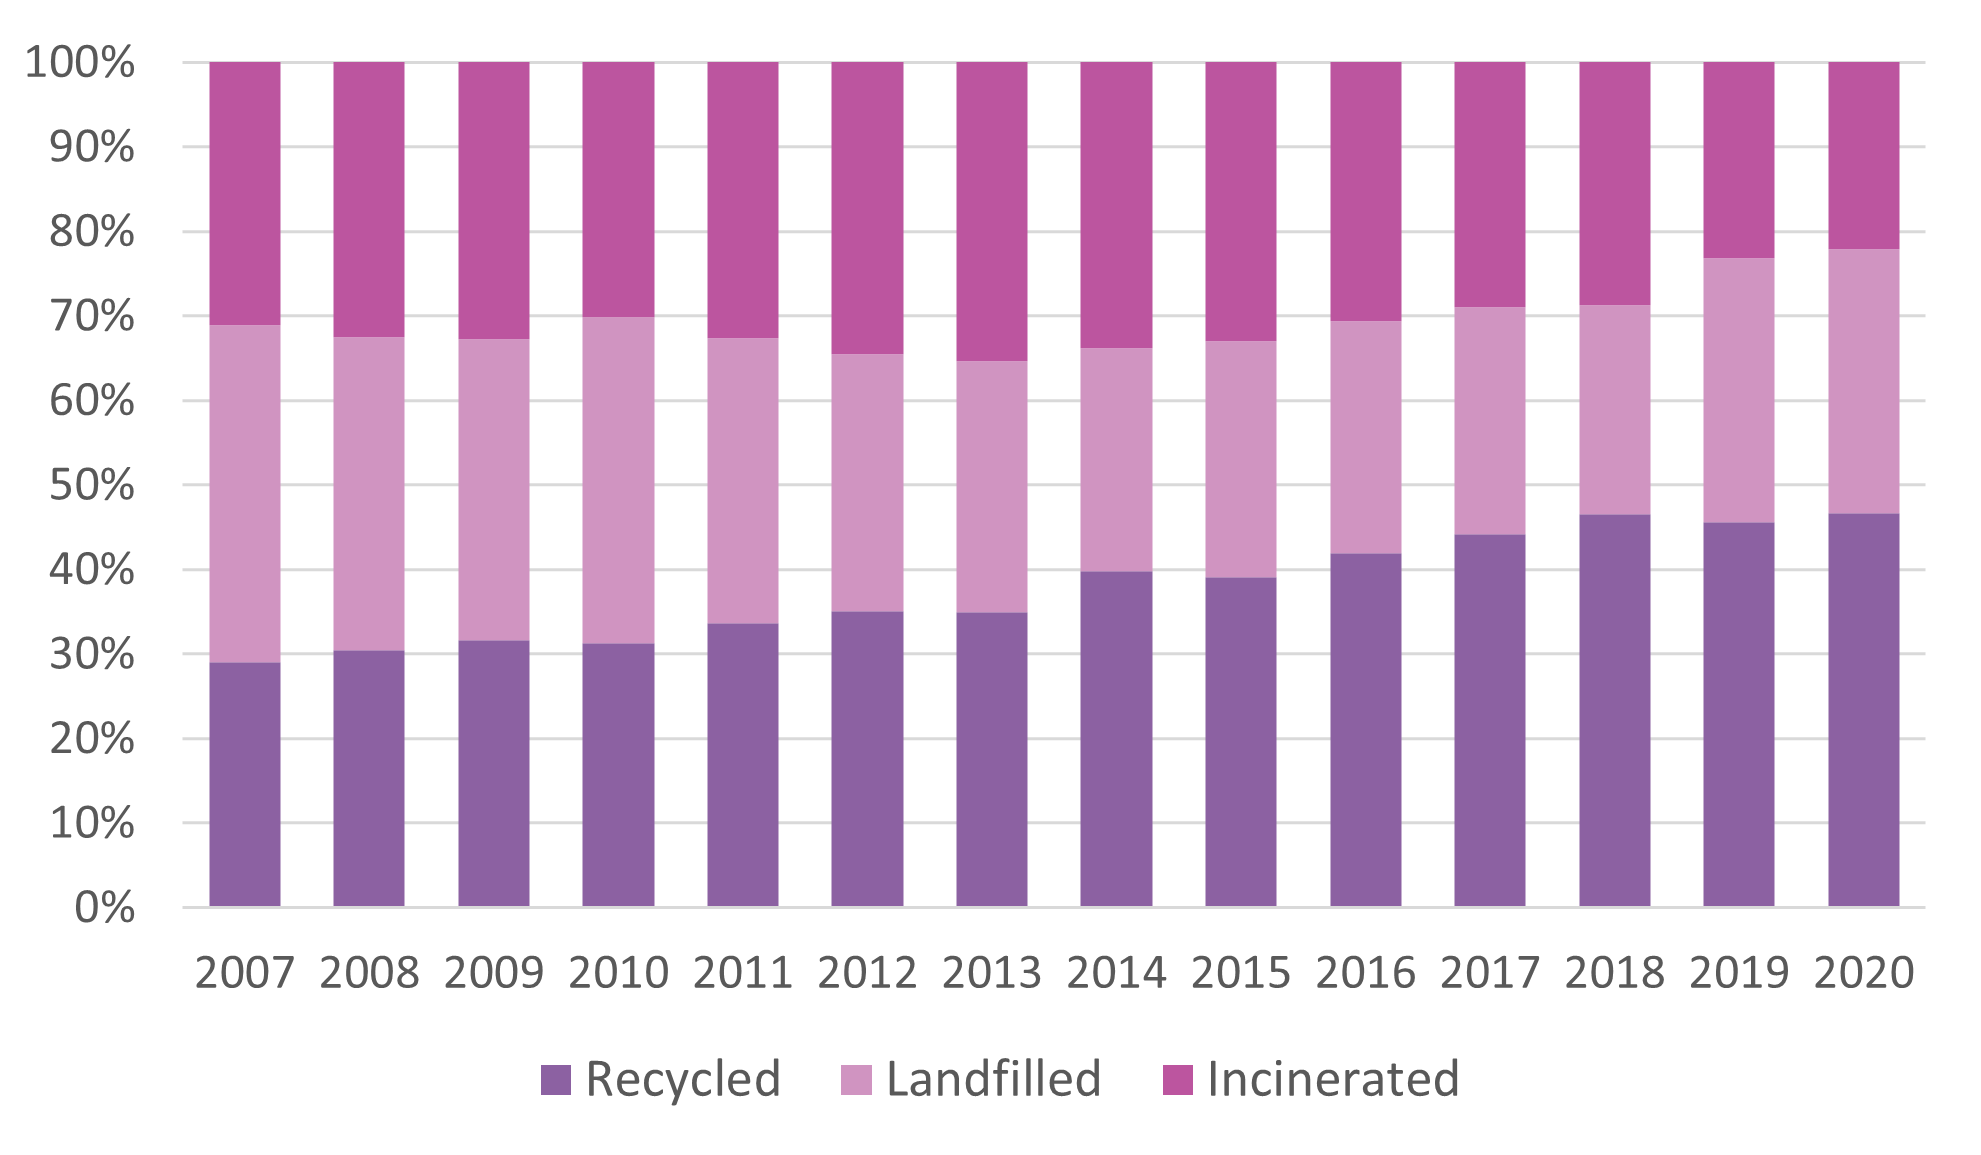
Waste sent to landfills and incineration facilities has decreased. The amount of waste per capita sent to landfills and incineration facilities decreased by 23% from 2007 to 2020 across the set of RII cities — from 3.8 pounds per person per day in 2007 to 2.9 pounds per person per day in 2020. Because the emissions rates at incineration facilities have increased over time, waste emissions only dropped by 17% over this same time period. Recycling rates have increased, but still have potential to grow. Some of the decrease in landfilled and incinerated waste can likely be attributed to increased recycling rates. In 2020, 47% of the municipal solid waste disposed by RII cities was recycled (including yard waste and organics recycling), up from 29% in 2007. Minnesota Statute 115A.551 establishes 2030 recycling rate goals of 35% for Greater Minnesota counties and 75% for metropolitan counties — leaving room for additional work.
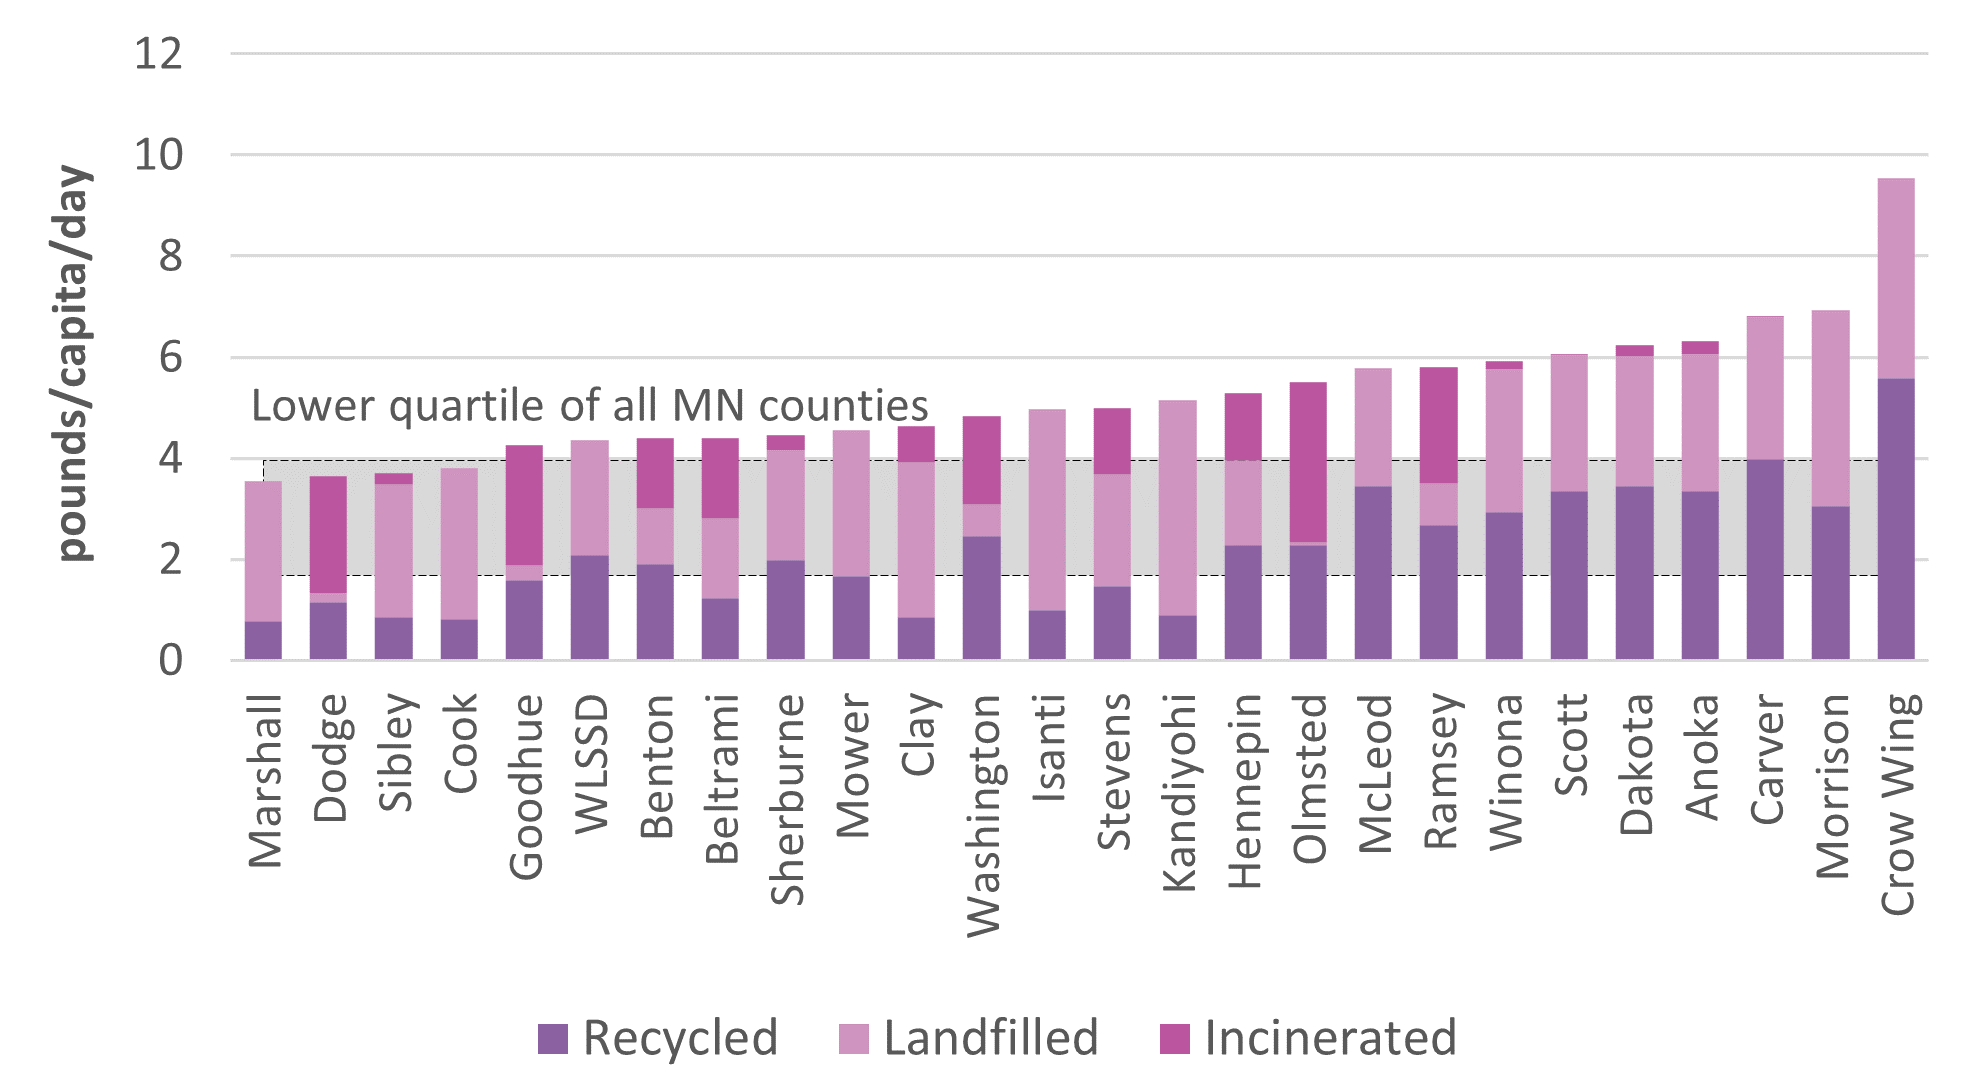
Waste management trends vary by county, but most have potential to reduce waste generation. The amount of waste generated per capita, percentage of waste recycled, and trends over time all vary quite a bit from county to county, making it worthwhile to view county-specific data via the City Summaries or Waste page or the MPCA's SCORE Report dashboard. A quarter of Minnesota's counties generate less than 4 pounds of waste per person daily, suggesting it may be possible for other counties to cut their own waste generation in half. |
PER CAPITA LANDFILLED AND INCINERATED WASTE TRENDS
WASTE BY MANAGEMENT METHOD
PER CAPITA WASTE BY MANAGEMENT METHOD
|
GHG EMISSIONS
|
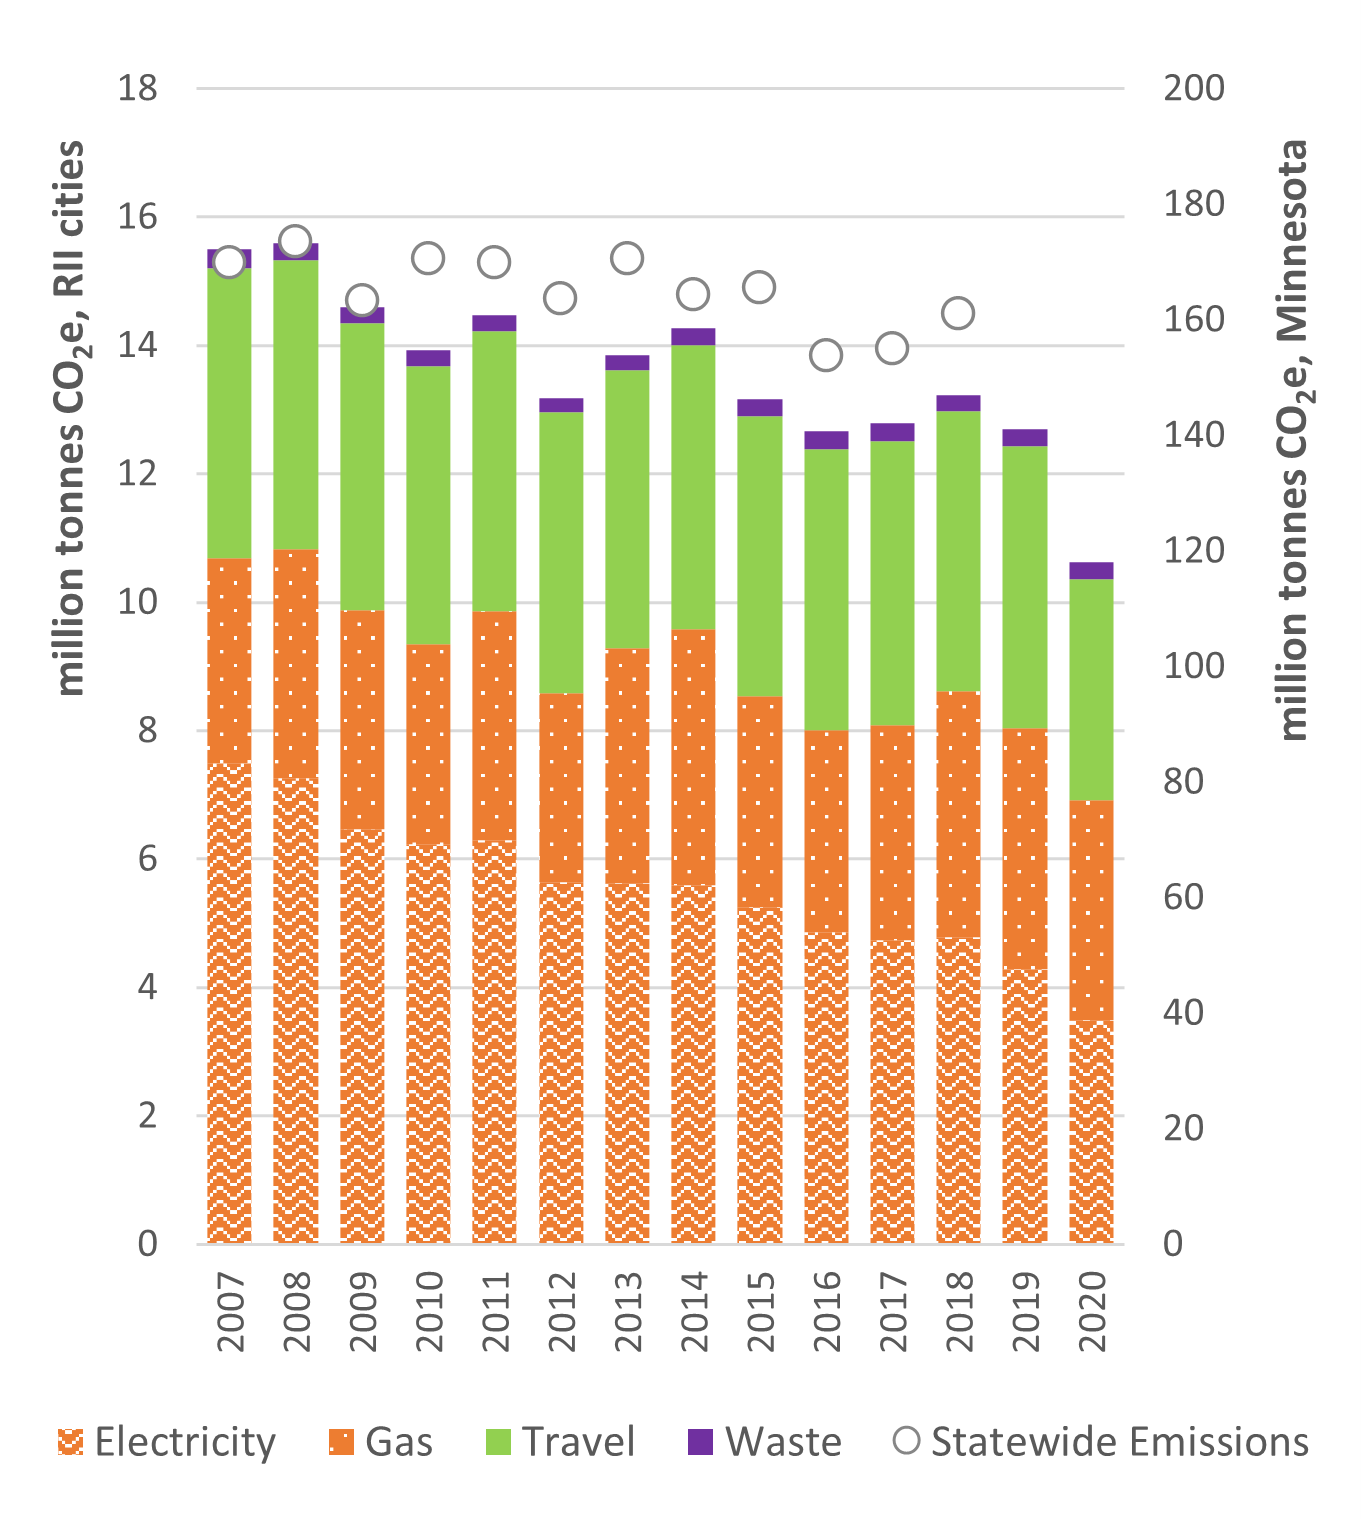
City-wide greenhouse gas emissions are decreasing more rapidly than state-wide emissions. Greenhouse gas emissions have decreased by 31% since 2007 — achieving the 2025 state milestone. And since our population has continued to grow, this equates to a 41% reduction in per capita emissions. However, a significant portion of these reductions were due to decreased vehicle travel during the COVID-19 pandemic, which has already begun to rebound. We are also seeing a need for cities to decarbonize more rapidly than the state as a whole to make up for the emissions from food production in Minnesota, which typically occurs outside city boundaries and has not yet seen meaningful and sustained reductions (Minnesota's Greenhouse Gas Emissions Inventory). The energy used in buildings continues to be the largest contributor to city-wide emissions. Building energy represents about two-thirds of total emissions for RII cities. However, this percentage has been dropping steadily since 2007 due to the rapid decarbonization of our electricity generation — which has caused electricity emissions to be cut in half. |
GREENHOUSE GAS EMISSIONS BY SECTOR
|
Emissions from gas used in buildings and from vehicle travel are now on par with emissions from electricity use.
In 2020 we see for the first time that emissions from electricity, gas, and vehicle emissions are all roughly equivalent, highlighting the importance of increasing efforts to decarbonize building heating and travel.
Each city is unique in their pie chart and the magnitude of emissions reductions, though most follow similar trends. Visit the City Summaries page to see city-specific data.
Call To Action
RII provides local government elected officials, staff, and community members with city-wide data and tools to inform their climate planning and action. The RII team recommends the following calls to action:
- Take high-impact action.
- Stop installing new gas equipment in buildings.
- Transition to heat pumps for space and water heating.
- Improve the insulation and air sealing in homes in order to make them less vulnerable to changes in weather. Do this for low-income households first, as these are the most vulnerable to extreme weather.
- Reduce reliance on vehicle travel by:
- Reexamining zoning patterns and regulations to encourage closer proximity between residents and businesses,
- Supporting public transportation,
- And implementing Complete Streets that support pedestrian and bike infrastructure. Strategies like adding more street trees can encourage more walking, increase economic activity, improve air quality, reduce urban heat, and sequester carbon.
- For the vehicle trips that are still needed, support the rapid adoption of electric vehicles by ensuring adequate charging infrastructure and ensure equitable access to EVs by supporting things like affordable car-share programs.
- Advocate for state and federal action.
- Clean energy
- More impactful energy codes for both commercial and residential new construction
- Large scale investment in building electrification and electric vehicles
- And even the institutionalization of data collection efforts like this one, by setting up systems to streamline community-scale energy data reporting and ensuring funding is available for ongoing data collection for all Minnesota communities.
- Leverage city-specific opportunities.
- Cities that expect a lot of new development in the coming decade can ensure that zoning and planning approvals prioritize higher density housing, mixed use areas, and transit-oriented development.
- They can also implement a sustainable building policy to achieve better energy efficiency and local renewable energy development than is required by code.
- Cities served by a utility that doesn’t plan to transition to carbon-free electricity can invest in local renewables or can perhaps enter a partnership with its utilities to meet its goals.
- Cities that host large institutions or industries can work together on these topics.
- Concentrated areas with diverse heating and cooling loads can share their waste heat through district energy systems.
- Cities with a large percentage of a certain type of building – whether restaurants, manufactured homes, or something else – can target programs to these buildings.
- And nearly every city will have local people with specialized knowledge, connections, and passion that can be transformative. Climate action in several Minnesota communities has been accelerated by high-schoolers participating in the iMatter program.
- Create a work plan.
- Track your progress.
We all have a pretty good idea of what needs to happen in order to meet our climate goals and this work becomes more urgent every single day. So don’t feel like you need the latest data or the perfect plan before you can act. You can act now to:
We’ve seen that state and federal policies can effectively drive change – from federal appliance standards to the state’s clean electricity standards, conservation improvement program requirements, and biofuel mandates. State and federal policies or funding could advance:
Local governments as well as residents can leverage city-specific opportunities that can be found by either looking at the data, doing scenario planning, or simply through local knowledge. For example:
We said you don’t have to have a plan to take action, but it is a good idea to document some of your decisions to commit to priorities, understand who needs to be involved, and provide a way to hold decision-makers accountable.
Finally, track your progress. There are a lot of different variables in play, and it’s easy to assume that your actions will make a difference… Prove it and adjust your approach accordingly.

